What is Economic Complexity?
- Economic complexity is a measure of the productive knowledge present in an economy based on the products that it exports with comparative advantage.
- A country has comparative advantage in a product if the share of that countries exports in a product is greater than the share of that products exports in global trade.
- Countries and products are ranked based on their level of complexity. Complex countries export many complex products with comparative advantage.
- Complex products include sophisticated chemicals and machinery, and the least complex products are agricultural products and raw materials.
- Economic complexity is important because it is a strong predictor and driver of future economic growth and reveals the trajectory of future growth. Countries with a higher level of complexity than their GDP would predict are more likely to grow faster in the future(Hausmann et al., 2013).
- Typically, economic complexity has been calculated at the national level – and a wealth of international data is available at the Atlas of Economic Complexity website at https://atlas.cid.harvard.edu/
Economic complexity of Australian States
- The Australian Industrial Transformation Institute has prepared a dataset of economic complexity for the 6 Australian states, and the Northern Territory. This dataset enables comparisons between Australian regions and international countries and provides a quantitative assessment of areas of strength and weakness, as well as opportunities for future growth.
- With the recent release of international export data for 2021, the economic complexity model for Australian regions has been updated. This update provides an additional year of product exports data and incorporates services exports for the first time.
Economic Complexity Index
The trend of declining economic complexity of Australian states has continued into 2021, except for Queensland which increased its ranking from 88 in 2020 to 85 in 2021.
![]()
Figure 1: Economic complexity ranking, Australian states and Northern Territory
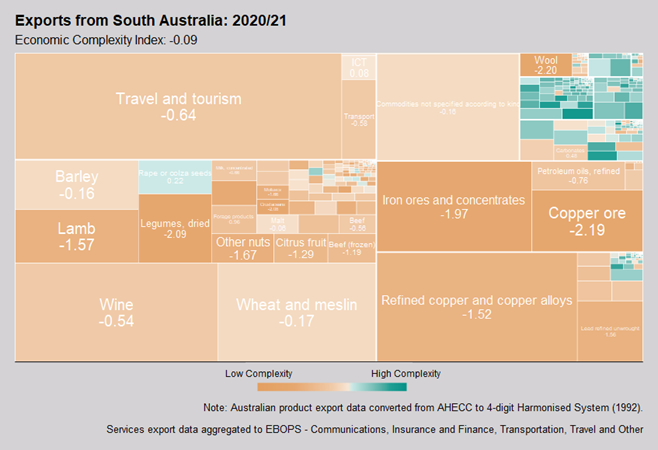
Low levels of economic complexity are the result of export baskets dominated by low complexity products and services.
Figure 2: South Australia’s export basket 2020/21.
Economic complexity can be an important tool for policy makers, national and regional governments by providing a quantitative base for modern policy efforts. This is particularly true for regions with low economic complexity, which is the case for many Australian states, as well as Australia as a whole. Declining manufacturing activity and deindustrialisation has reduced the potential to leverage existing knowledge and capabilities into new more complex activities and creates a negative path dependency between current capabilities and future development. Because of this, policy directives for regions with low economic complexity may require more distinct and interventionist approaches – to push against this path dependency – than would be suitable in more advanced economies.
Methodology
Data sources
- International trade data is sourced from the Atlas of Economic Complexity website (The Growth Lab at Harvard University, 2019). This data set has overseas exports for 5,040 products (and 5 services) for 251 countries over the period 1994 – 2021. The products are classified based on the 1992 revision of the Harmonised System, called HS0 at a 6-digit level.
- Overseas exports for the Australian States are sourced from the Queensland Government Statistician’s Office (Queensland Government Statistician’s Office, 2023). This data set has overseas exports for 6,108 products for all States and Territories of Australia over the period 1995/96 – 2021/22. The products are classified by the Australian Harmonised Export Commodity Classification (AHECC) at an 8-digit level.
- Note that some products are subject to Broad Commodity Details restrictions whose export value are not assigned to a State or Territory. However, the total value of confidential items exported is reported for each State and Territory. This is consistent with the Harmonised System code 9999: Commodities not specified according to kind.
- It is important to note that there is a higher proportion of confidential trade at the State level than at the national level.
- Services data is sourced from the Australian Bureau of Statistics (Australian Bureau of Statistics, 2022). Services are aggregated into the five Extended Balance of Payments (2010) classification across 5 categories to coincide with the Atlas of Economic Complexity. These categories are: Communications, Insurance and Finance, Transportation, Travel and Other.
Data processing
- The international trade dataset for the Australian States and Territories is converted from the AHECC to the 1992 revision of the Harmonised System[1] using a recursive algorithm. Export values are converted from Australian to US dollars by applying the average exchange rate over the financial year.
- The State trade dataset is appended to the Atlas international dataset, and Australia is removed from the international data set. Financial year data is assumed to occur within the calendar year for consistency with Atlas of Economic Complexity data.
- Products and countries not represented on the Atlas of Economic Complexity website are removed. Additionally, the following adjustments are made:
- Australian Capital Territory is excluded from the dataset as their export volume is less than 1 billion USD per annum.
- Economic complexity indicators are calculated for each year between 1996 and 2021.
Author: Hamish Gamble, Senior Economic Analyst [hamish.gamble@flinders.edu.au]
Works Cited
- Australian Bureau of Statistics. (2022). International Trade: Supplementary Information, Financial Year, 2021-22.
- Hausmann, R., Hidalgo, C. A., Bustos, S., Coscia, M., Simoes, A., & Yildirim, M. A. (2013). The Atlas of Economic Complexity: Mapping Paths to Prosperity: MIT Press.
- Queensland Government Statistician’s Office. (2023). Exports of merchandise goods to all states/territories of Australia by the commody classification AHECC pivot tables. Retrieved from: https://www.qgso.qld.gov.au/statistics/theme/economy/international-trade/exports}
- The Growth Lab at Harvard University. (2019). International Trade Data (HS, 92).
[1] As there are more AHECC codes than HS0 codes some information is lost when converting between the two classifications. These typically are additional Australian specific products or products of high economic importance to Australia. For example, the AHECC captures exports of Live Australian endemic animals. In the HS0, these are recorded as `Non-Farm animals’.